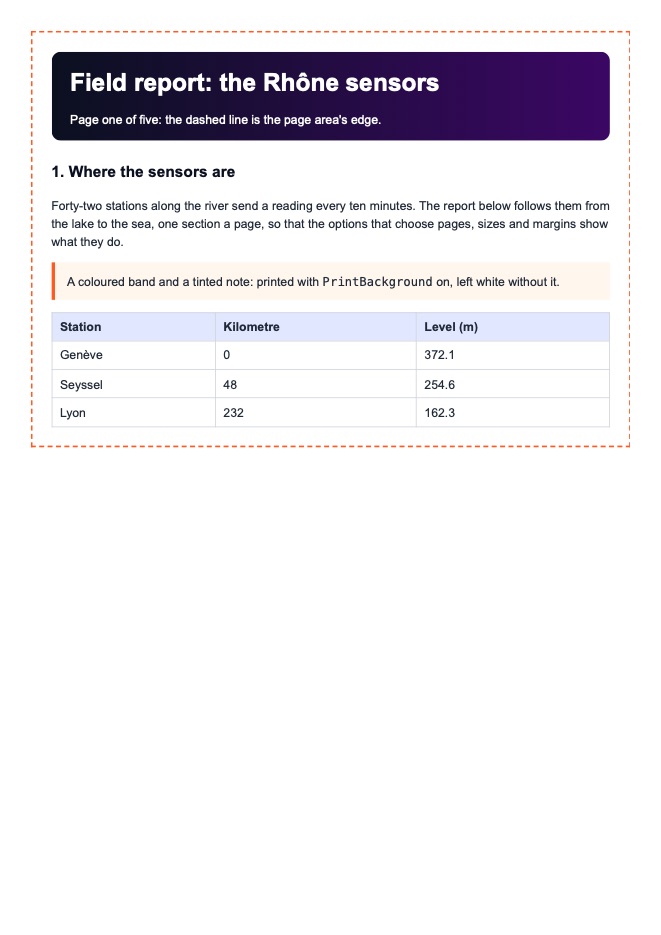
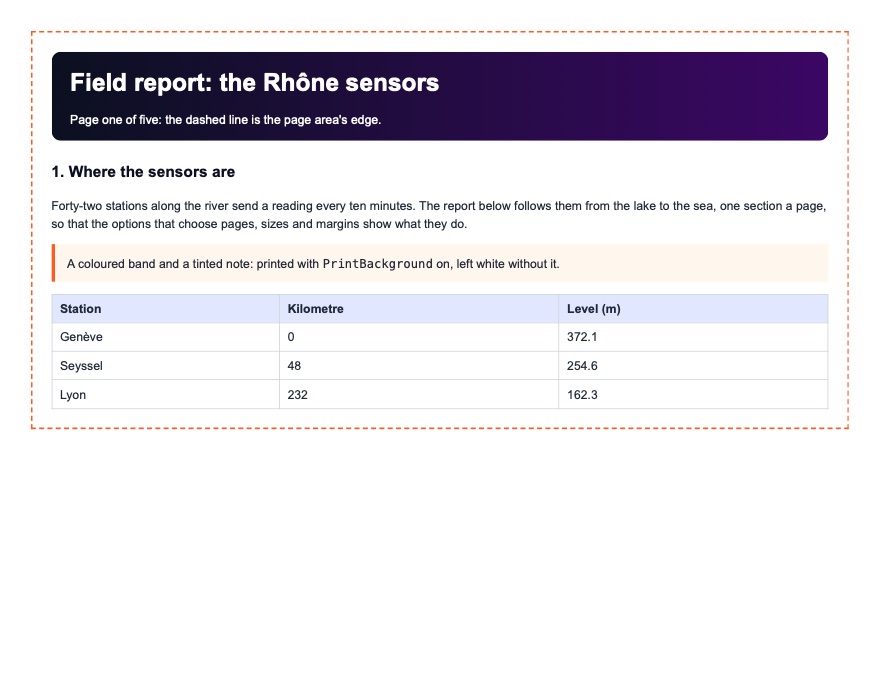
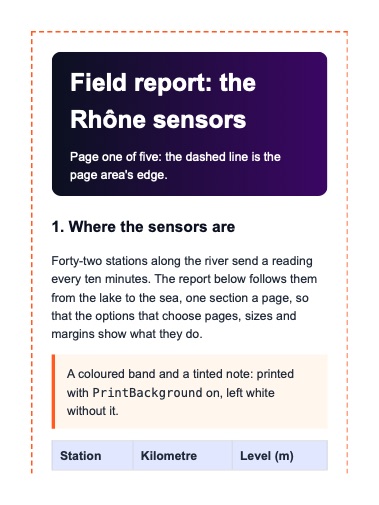
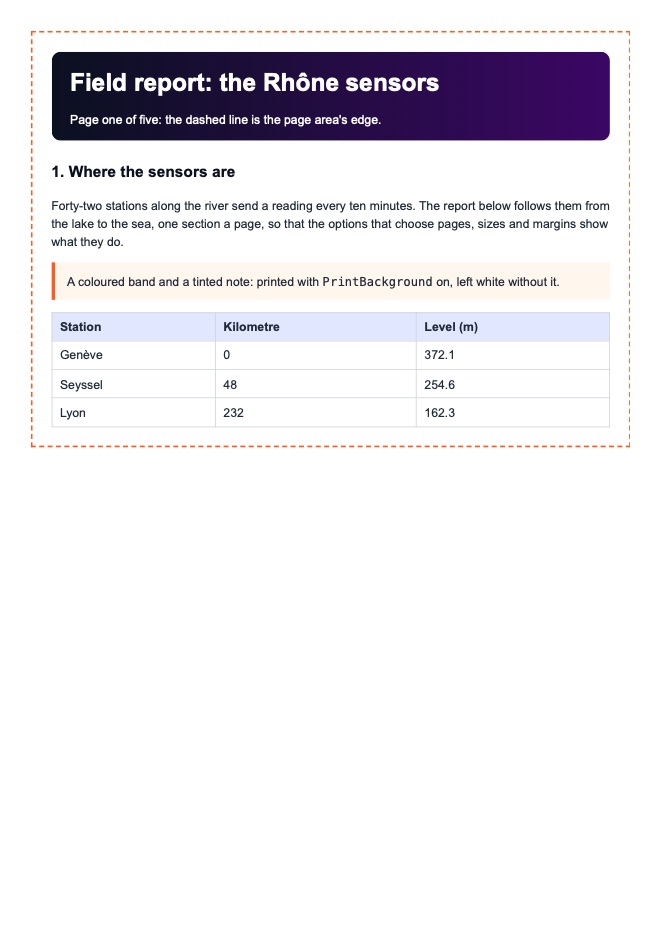
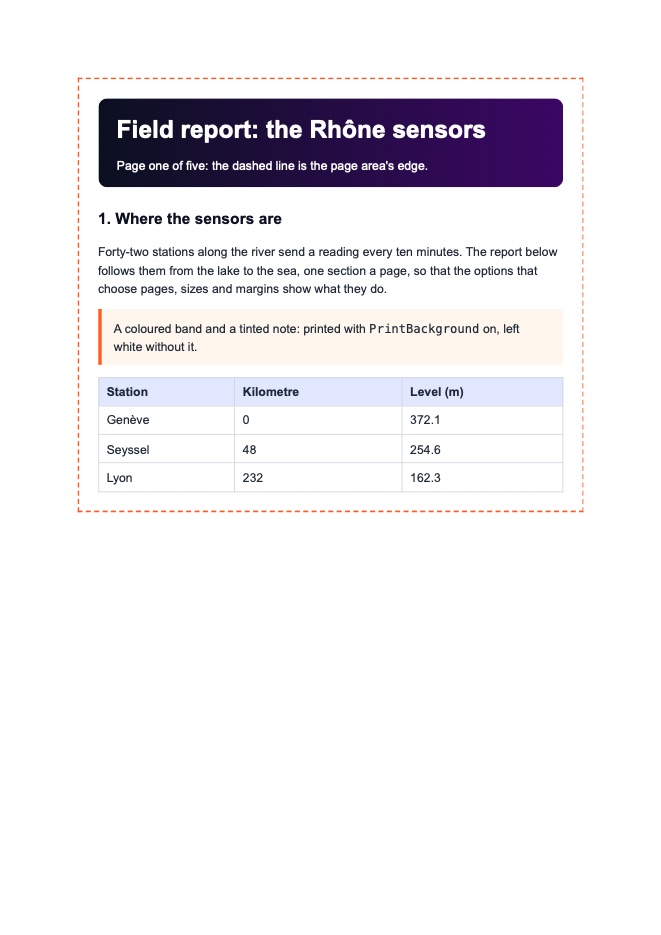
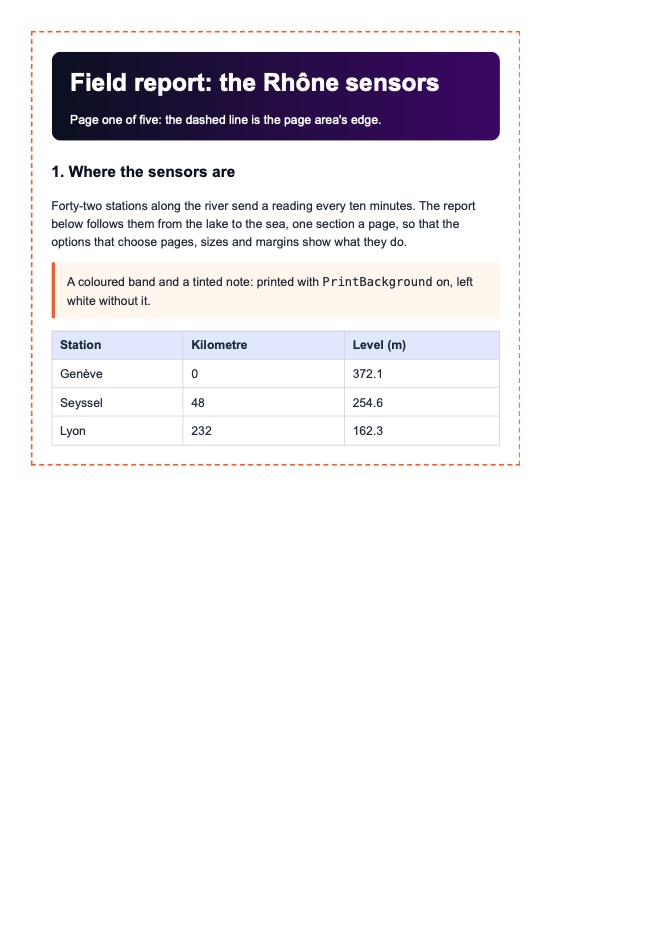
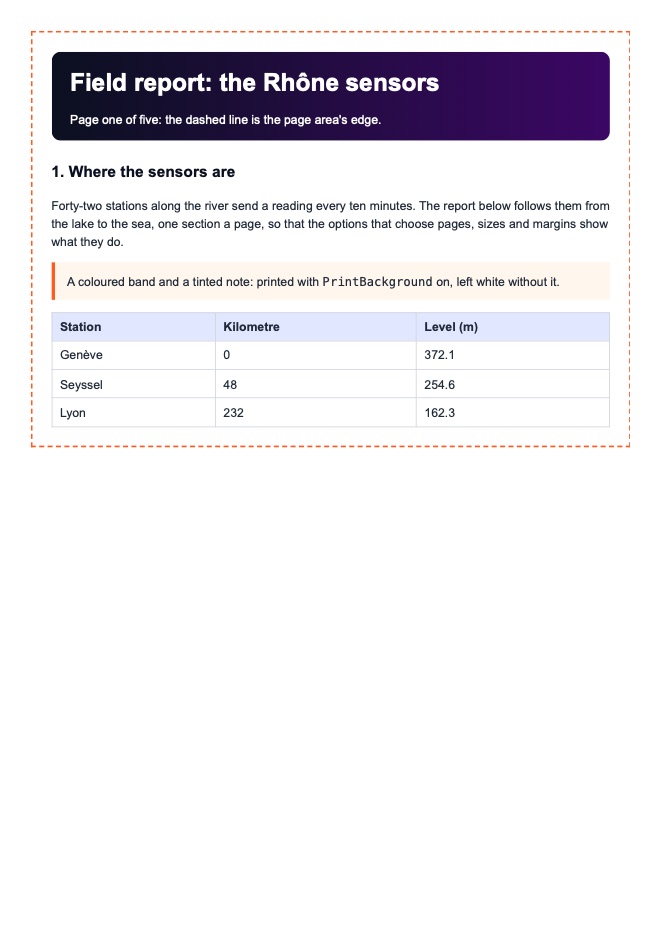
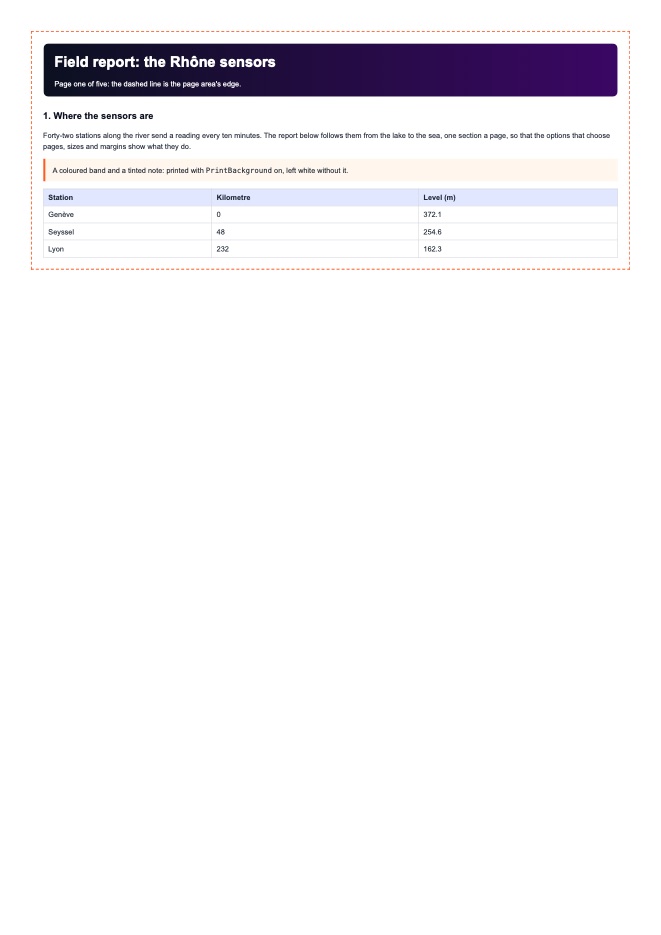
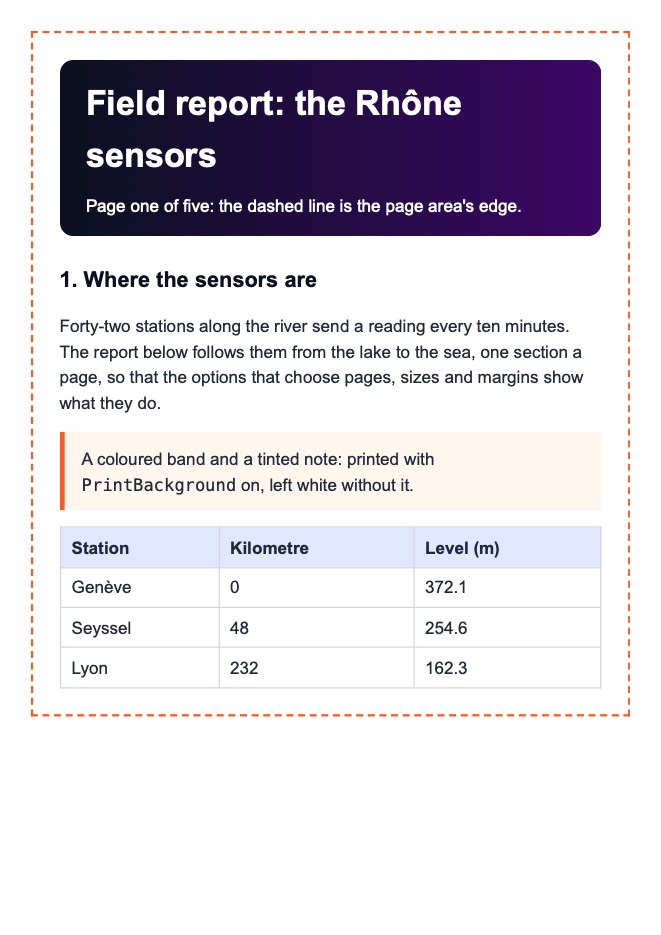
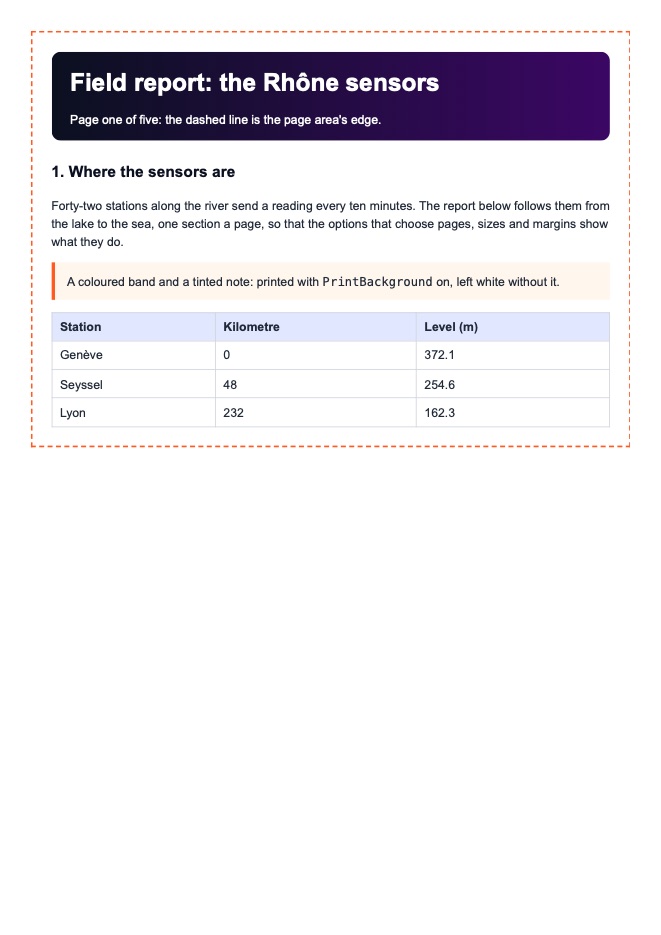
For each option that changes what comes out: a small page, the C# that sets the option, and the pages Weblitz printed, beside the default where that shows the difference. Made on 2026-11-07 on macOS; the pages are drawn from the PDFs, which are downloads. What the engine noted is shown as it came back, including what it does not do yet.
<!DOCTYPE html>
<html lang="en"><head><meta charset="utf-8"><title>Field report: the Rhône sensors</title>
<style>
  body { font: 11pt/1.5 Arial, sans-serif; color: #1f2937; margin: 0; }
  .frame { border: 2px dashed #ff5a1f; padding: 6mm; }
  h1 { font-size: 22pt; margin: 0 0 3mm; color: #0b1020; }
  h2 { font-size: 14pt; margin: 6mm 0 2mm; color: #0b1020; }
  .band { background: linear-gradient(90deg, #0b1020, #3b0764); color: #fff; padding: 4mm 6mm; border-radius: 3mm; }
  .note { background: #fff7ed; border-left: 4px solid #ff5a1f; padding: 3mm 4mm; }
  table { border-collapse: collapse; width: 100%; margin-top: 3mm; }
  th, td { border: 1px solid #d1d5db; padding: 1.5mm 2.5mm; text-align: left; }
  th { background: #e0e7ff; }
  .page-break { break-before: page; }
</style></head>
<body>
<div class="frame">
  <div class="band"><h1 style="color:#fff">Field report: the Rhône sensors</h1>Page one of five: the dashed line is the page area's edge.</div>
  <h2>1. Where the sensors are</h2>
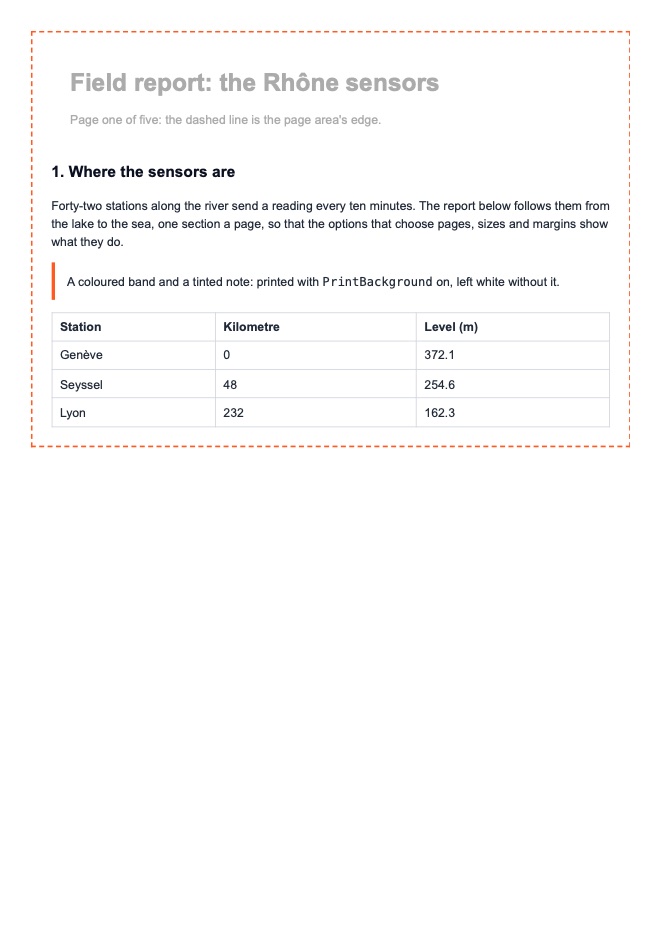
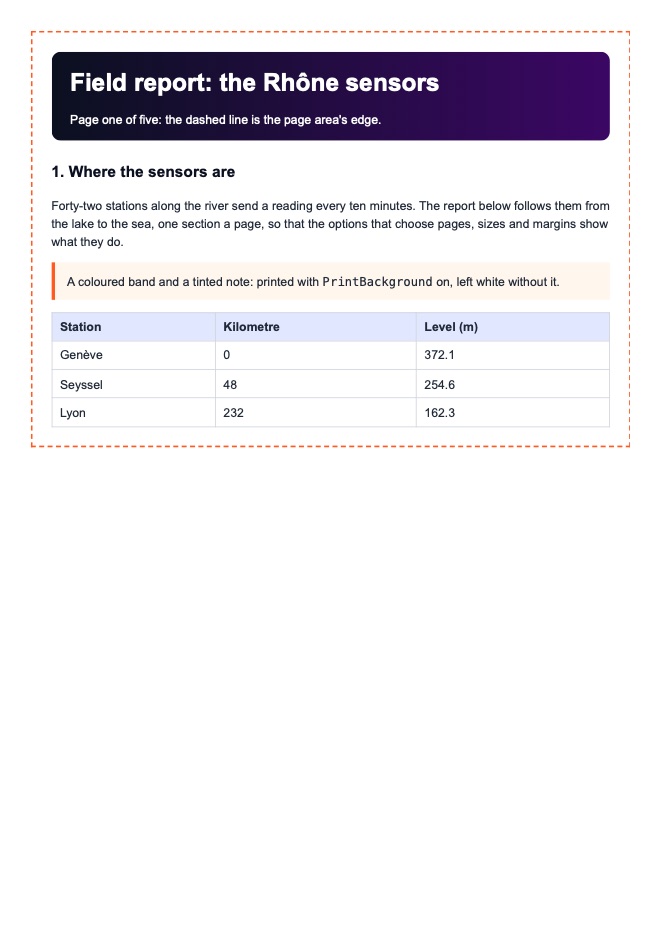
  <p>Forty-two stations along the river send a reading every ten minutes. The report below follows them from the lake to the sea, one section a page, so that the options that choose pages, sizes and margins show what they do.</p>
  <p class="note">A coloured band and a tinted note: printed with <code>PrintBackground</code> on, left white without it.</p>
  <table><tr><th>Station</th><th>Kilometre</th><th>Level (m)</th></tr>
    <tr><td>Genève</td><td>0</td><td>372.1</td></tr><tr><td>Seyssel</td><td>48</td><td>254.6</td></tr><tr><td>Lyon</td><td>232</td><td>162.3</td></tr></table>
</div>
<div class="frame page-break"><div class="band">Page two of five</div><h2>2. The upper river</h2><p>The upper river is fast and cold: its stations read the level every ten minutes and the temperature every hour.</p></div>
<div class="frame page-break"><div class="band">Page three of five</div><h2>3. Lyon</h2><p>At Lyon the Saône joins: the station reads both rivers.</p></div>
<div class="frame page-break"><div class="band">Page four of five</div><h2>4. The lower river</h2><p>Dams turn the lower river into a staircase of reaches.</p></div>
<div class="frame page-break"><div class="band">Page five of five</div><h2>5. The delta</h2><p>In the Camargue the river splits in two before the sea.</p></div>
</body></html>
<!DOCTYPE html>
<html lang="en"><head><meta charset="utf-8"><title>Field report: the Rhône sensors</title>
<style>
  body { font: 11pt/1.5 Arial, sans-serif; color: #1f2937; margin: 0; }
  .frame { border: 2px dashed #ff5a1f; padding: 6mm; }
  h1 { font-size: 22pt; margin: 0 0 3mm; color: #0b1020; }
  h2 { font-size: 14pt; margin: 6mm 0 2mm; color: #0b1020; }
  .band { background: linear-gradient(90deg, #0b1020, #3b0764); color: #fff; padding: 4mm 6mm; border-radius: 3mm; }
  .note { background: #fff7ed; border-left: 4px solid #ff5a1f; padding: 3mm 4mm; }
  table { border-collapse: collapse; width: 100%; margin-top: 3mm; }
  th, td { border: 1px solid #d1d5db; padding: 1.5mm 2.5mm; text-align: left; }
  th { background: #e0e7ff; }
  .page-break { break-before: page; }
</style></head>
<body>
<div class="frame">
  <div class="band"><h1 style="color:#fff">Field report: the Rhône sensors</h1>Page one of five: the dashed line is the page area's edge.</div>
  <h2>1. Where the sensors are</h2>
  <p>Forty-two stations along the river send a reading every ten minutes. The report below follows them from the lake to the sea, one section a page, so that the options that choose pages, sizes and margins show what they do.</p>
  <p class="note">A coloured band and a tinted note: printed with <code>PrintBackground</code> on, left white without it.</p>
  <table><tr><th>Station</th><th>Kilometre</th><th>Level (m)</th></tr>
    <tr><td>Genève</td><td>0</td><td>372.1</td></tr><tr><td>Seyssel</td><td>48</td><td>254.6</td></tr><tr><td>Lyon</td><td>232</td><td>162.3</td></tr></table>
</div>
<div class="frame page-break"><div class="band">Page two of five</div><h2>2. The upper river</h2><p>The upper river is fast and cold: its stations read the level every ten minutes and the temperature every hour.</p></div>
<div class="frame page-break"><div class="band">Page three of five</div><h2>3. Lyon</h2><p>At Lyon the Saône joins: the station reads both rivers.</p></div>
<div class="frame page-break"><div class="band">Page four of five</div><h2>4. The lower river</h2><p>Dams turn the lower river into a staircase of reaches.</p></div>
<div class="frame page-break"><div class="band">Page five of five</div><h2>5. The delta</h2><p>In the Camargue the river splits in two before the sea.</p></div>
</body></html>
<!DOCTYPE html>
<html lang="en"><head><meta charset="utf-8"><title>Field report: the Rhône sensors</title>
<style>
  body { font: 11pt/1.5 Arial, sans-serif; color: #1f2937; margin: 0; }
  .frame { border: 2px dashed #ff5a1f; padding: 6mm; }
  h1 { font-size: 22pt; margin: 0 0 3mm; color: #0b1020; }
  h2 { font-size: 14pt; margin: 6mm 0 2mm; color: #0b1020; }
  .band { background: linear-gradient(90deg, #0b1020, #3b0764); color: #fff; padding: 4mm 6mm; border-radius: 3mm; }
  .note { background: #fff7ed; border-left: 4px solid #ff5a1f; padding: 3mm 4mm; }
  table { border-collapse: collapse; width: 100%; margin-top: 3mm; }
  th, td { border: 1px solid #d1d5db; padding: 1.5mm 2.5mm; text-align: left; }
  th { background: #e0e7ff; }
  .page-break { break-before: page; }
</style></head>
<body>
<div class="frame">
  <div class="band"><h1 style="color:#fff">Field report: the Rhône sensors</h1>Page one of five: the dashed line is the page area's edge.</div>
  <h2>1. Where the sensors are</h2>
  <p>Forty-two stations along the river send a reading every ten minutes. The report below follows them from the lake to the sea, one section a page, so that the options that choose pages, sizes and margins show what they do.</p>
  <p class="note">A coloured band and a tinted note: printed with <code>PrintBackground</code> on, left white without it.</p>
  <table><tr><th>Station</th><th>Kilometre</th><th>Level (m)</th></tr>
    <tr><td>Genève</td><td>0</td><td>372.1</td></tr><tr><td>Seyssel</td><td>48</td><td>254.6</td></tr><tr><td>Lyon</td><td>232</td><td>162.3</td></tr></table>
</div>
<div class="frame page-break"><div class="band">Page two of five</div><h2>2. The upper river</h2><p>The upper river is fast and cold: its stations read the level every ten minutes and the temperature every hour.</p></div>
<div class="frame page-break"><div class="band">Page three of five</div><h2>3. Lyon</h2><p>At Lyon the Saône joins: the station reads both rivers.</p></div>
<div class="frame page-break"><div class="band">Page four of five</div><h2>4. The lower river</h2><p>Dams turn the lower river into a staircase of reaches.</p></div>
<div class="frame page-break"><div class="band">Page five of five</div><h2>5. The delta</h2><p>In the Camargue the river splits in two before the sea.</p></div>
</body></html>
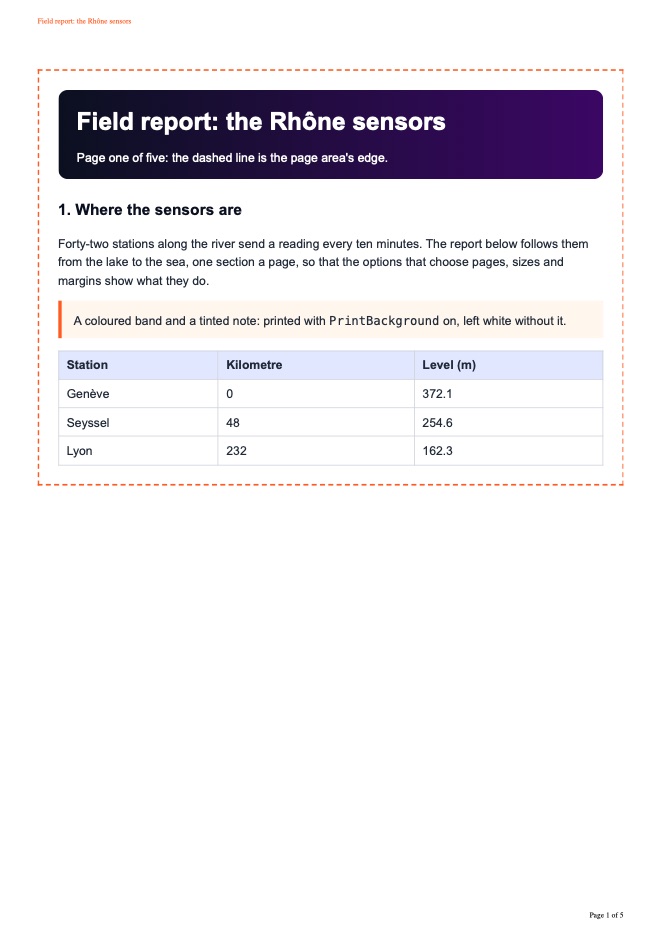
The templates are HTML printed in the top and bottom margins of every page, as Chrome prints them; elements with the classes pageNumber, totalPages, title, url and date are filled in. A template that sets no font size gets Chrome's tiny default: set one. Give the margins room for them.
<!DOCTYPE html>
<html lang="en"><head><meta charset="utf-8"><title>Field report: the Rhône sensors</title>
<style>
  body { font: 11pt/1.5 Arial, sans-serif; color: #1f2937; margin: 0; }
  .frame { border: 2px dashed #ff5a1f; padding: 6mm; }
  h1 { font-size: 22pt; margin: 0 0 3mm; color: #0b1020; }
  h2 { font-size: 14pt; margin: 6mm 0 2mm; color: #0b1020; }
  .band { background: linear-gradient(90deg, #0b1020, #3b0764); color: #fff; padding: 4mm 6mm; border-radius: 3mm; }
  .note { background: #fff7ed; border-left: 4px solid #ff5a1f; padding: 3mm 4mm; }
  table { border-collapse: collapse; width: 100%; margin-top: 3mm; }
  th, td { border: 1px solid #d1d5db; padding: 1.5mm 2.5mm; text-align: left; }
  th { background: #e0e7ff; }
  .page-break { break-before: page; }
</style></head>
<body>
<div class="frame">
  <div class="band"><h1 style="color:#fff">Field report: the Rhône sensors</h1>Page one of five: the dashed line is the page area's edge.</div>
  <h2>1. Where the sensors are</h2>
  <p>Forty-two stations along the river send a reading every ten minutes. The report below follows them from the lake to the sea, one section a page, so that the options that choose pages, sizes and margins show what they do.</p>
  <p class="note">A coloured band and a tinted note: printed with <code>PrintBackground</code> on, left white without it.</p>
  <table><tr><th>Station</th><th>Kilometre</th><th>Level (m)</th></tr>
    <tr><td>Genève</td><td>0</td><td>372.1</td></tr><tr><td>Seyssel</td><td>48</td><td>254.6</td></tr><tr><td>Lyon</td><td>232</td><td>162.3</td></tr></table>
</div>
<div class="frame page-break"><div class="band">Page two of five</div><h2>2. The upper river</h2><p>The upper river is fast and cold: its stations read the level every ten minutes and the temperature every hour.</p></div>
<div class="frame page-break"><div class="band">Page three of five</div><h2>3. Lyon</h2><p>At Lyon the Saône joins: the station reads both rivers.</p></div>
<div class="frame page-break"><div class="band">Page four of five</div><h2>4. The lower river</h2><p>Dams turn the lower river into a staircase of reaches.</p></div>
<div class="frame page-break"><div class="band">Page five of five</div><h2>5. The delta</h2><p>In the Camargue the river splits in two before the sea.</p></div>
</body></html>
Header and footer
var result = HtmlToPdf.Render(html, new HtmlPdfOptions
{
    DisplayHeaderFooter = true,
    Margin = new HtmlMargins("22mm", "12mm", "20mm", "12mm"),
    HeaderTemplate = "<div style='font-size:9px; width:100%; padding:0 12mm; color:#ff5a1f'><span class='title'></span></div>",
    FooterTemplate = "<div style='font-size:9px; width:100%; padding:0 12mm; text-align:right'>Page <span class='pageNumber'></span> of <span class='totalPages'></span></div>",
});
<!DOCTYPE html>
<html lang="en"><head><meta charset="utf-8"><title>Field report: the Rhône sensors</title>
<style>
  body { font: 11pt/1.5 Arial, sans-serif; color: #1f2937; margin: 0; }
  .frame { border: 2px dashed #ff5a1f; padding: 6mm; }
  h1 { font-size: 22pt; margin: 0 0 3mm; color: #0b1020; }
  h2 { font-size: 14pt; margin: 6mm 0 2mm; color: #0b1020; }
  .band { background: linear-gradient(90deg, #0b1020, #3b0764); color: #fff; padding: 4mm 6mm; border-radius: 3mm; }
  .note { background: #fff7ed; border-left: 4px solid #ff5a1f; padding: 3mm 4mm; }
  table { border-collapse: collapse; width: 100%; margin-top: 3mm; }
  th, td { border: 1px solid #d1d5db; padding: 1.5mm 2.5mm; text-align: left; }
  th { background: #e0e7ff; }
  .page-break { break-before: page; }
</style></head>
<body>
<div class="frame">
  <div class="band"><h1 style="color:#fff">Field report: the Rhône sensors</h1>Page one of five: the dashed line is the page area's edge.</div>
  <h2>1. Where the sensors are</h2>
  <p>Forty-two stations along the river send a reading every ten minutes. The report below follows them from the lake to the sea, one section a page, so that the options that choose pages, sizes and margins show what they do.</p>
  <p class="note">A coloured band and a tinted note: printed with <code>PrintBackground</code> on, left white without it.</p>
  <table><tr><th>Station</th><th>Kilometre</th><th>Level (m)</th></tr>
    <tr><td>Genève</td><td>0</td><td>372.1</td></tr><tr><td>Seyssel</td><td>48</td><td>254.6</td></tr><tr><td>Lyon</td><td>232</td><td>162.3</td></tr></table>
</div>
<div class="frame page-break"><div class="band">Page two of five</div><h2>2. The upper river</h2><p>The upper river is fast and cold: its stations read the level every ten minutes and the temperature every hour.</p></div>
<div class="frame page-break"><div class="band">Page three of five</div><h2>3. Lyon</h2><p>At Lyon the Saône joins: the station reads both rivers.</p></div>
<div class="frame page-break"><div class="band">Page four of five</div><h2>4. The lower river</h2><p>Dams turn the lower river into a staircase of reaches.</p></div>
<div class="frame page-break"><div class="band">Page five of five</div><h2>5. The delta</h2><p>In the Camargue the river splits in two before the sea.</p></div>
</body></html>
<!DOCTYPE html>
<html lang="en"><head><meta charset="utf-8"><title>Field report: the Rhône sensors</title>
<style>
  body { font: 11pt/1.5 Arial, sans-serif; color: #1f2937; margin: 0; }
  .frame { border: 2px dashed #ff5a1f; padding: 6mm; }
  h1 { font-size: 22pt; margin: 0 0 3mm; color: #0b1020; }
  h2 { font-size: 14pt; margin: 6mm 0 2mm; color: #0b1020; }
  .band { background: linear-gradient(90deg, #0b1020, #3b0764); color: #fff; padding: 4mm 6mm; border-radius: 3mm; }
  .note { background: #fff7ed; border-left: 4px solid #ff5a1f; padding: 3mm 4mm; }
  table { border-collapse: collapse; width: 100%; margin-top: 3mm; }
  th, td { border: 1px solid #d1d5db; padding: 1.5mm 2.5mm; text-align: left; }
  th { background: #e0e7ff; }
  .page-break { break-before: page; }
</style></head>
<body>
<div class="frame">
  <div class="band"><h1 style="color:#fff">Field report: the Rhône sensors</h1>Page one of five: the dashed line is the page area's edge.</div>
  <h2>1. Where the sensors are</h2>
  <p>Forty-two stations along the river send a reading every ten minutes. The report below follows them from the lake to the sea, one section a page, so that the options that choose pages, sizes and margins show what they do.</p>
  <p class="note">A coloured band and a tinted note: printed with <code>PrintBackground</code> on, left white without it.</p>
  <table><tr><th>Station</th><th>Kilometre</th><th>Level (m)</th></tr>
    <tr><td>Genève</td><td>0</td><td>372.1</td></tr><tr><td>Seyssel</td><td>48</td><td>254.6</td></tr><tr><td>Lyon</td><td>232</td><td>162.3</td></tr></table>
</div>
<div class="frame page-break"><div class="band">Page two of five</div><h2>2. The upper river</h2><p>The upper river is fast and cold: its stations read the level every ten minutes and the temperature every hour.</p></div>
<div class="frame page-break"><div class="band">Page three of five</div><h2>3. Lyon</h2><p>At Lyon the Saône joins: the station reads both rivers.</p></div>
<div class="frame page-break"><div class="band">Page four of five</div><h2>4. The lower river</h2><p>Dams turn the lower river into a staircase of reaches.</p></div>
<div class="frame page-break"><div class="band">Page five of five</div><h2>5. The delta</h2><p>In the Camargue the river splits in two before the sea.</p></div>
</body></html>
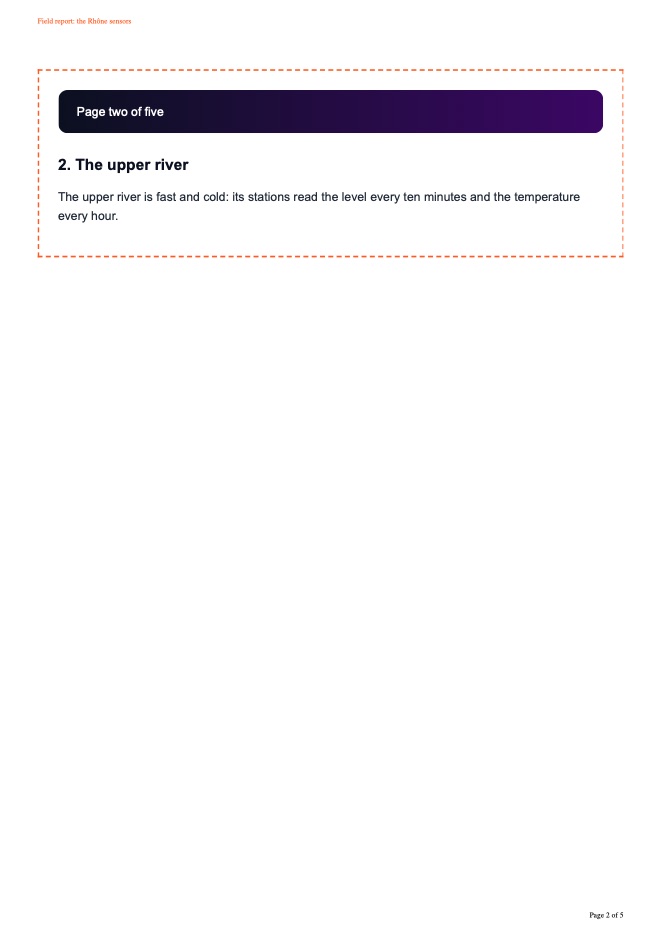
"2-3, 5"
var result = HtmlToPdf.Render(html, new HtmlPdfOptions { PageRanges = "2-3, 5" });
Scripts run once before printing; timers run in virtual time for WaitFor (5 seconds by default), so a page's 2-second timer fires and its 8-second one only with a longer wait. beforeprint runs just before the PDF is made.
The network is off by default: a page's web addresses are not fetched and noted instead. Allow the hosts a page may load from (assets is a server the generator starts on this machine).
<!DOCTYPE html>
<html lang="en"><head><meta charset="utf-8"><title>Network</title>
<link rel="stylesheet" href="brand.css">
<style>body { font: 12pt/1.5 Arial, sans-serif; margin: 0; } img { width: 40mm; display: block; margin: 4mm 0; }</style></head>
<body>
<h1 class="brand">A page whose picture and CSS are on a server</h1>
<img src="logo.svg" alt="The logo, fetched from the server">
<p>The heading's colour comes from <code>brand.css</code> and the picture from <code>logo.svg</code>, both fetched over HTTP.</p>
</body></html>
Off (default)
var result = HtmlToPdf.Render(html, new HtmlPdfOptions { BaseUrl = assets });
A page your server shows only to signed-in users prints with what a browser would send: a bearer token, a session cookie, or a password for HTTP authentication. Each goes only to the hosts it names, by default the document's own (assets is a server the generator starts on this machine; its account pages need one of them).
<!DOCTYPE html>
<html lang="en"><head><meta charset="utf-8"><title>Account statement</title>
<link rel="stylesheet" href="../brand.css">
<style>
  body { font: 11pt/1.5 Arial, sans-serif; margin: 0; }
  table { border-collapse: collapse; width: 100%; margin-top: 6mm; }
  th, td { border-bottom: 1px solid #d0d4dc; padding: 2mm 3mm; text-align: left; }
  td.n { text-align: right; font-variant-numeric: tabular-nums; }
  .who { color: #555; }
</style></head>
<body>
<h1 class="brand">Account statement, October 2026</h1>
<p class="who">Signed in as <strong id="user">a customer</strong>: this page is served only with a valid session.</p>
<table>
  <tr><th>Date</th><th>Description</th><th class="n">Amount</th></tr>
  <tr><td>2026-10-03</td><td>Subscription, October</td><td class="n">-49.00</td></tr>
  <tr><td>2026-10-14</td><td>Refund, order 1182</td><td class="n">12.50</td></tr>
  <tr><td>2026-10-28</td><td>Top-up</td><td class="n">200.00</td></tr>
</table>
<script>
  // what the page's own scripts see of the session (an HttpOnly cookie never shows here)
  const theme = document.cookie.split('; ').find(c => c.startsWith('theme='));
  if (theme) document.getElementById('user').textContent += ' (theme ' + theme.slice(6) + ')';
</script>
</body></html>
A bearer token
var result = HtmlToPdf.RenderUrl(new Uri(assets, "account/statement.html"), new HtmlPdfOptions
{
    Network = HtmlNetwork.Allow(assets.Host).WithBearerToken(accessToken),
});
<!DOCTYPE html>
<html lang="en"><head><meta charset="utf-8"><title>Field report: the Rhône sensors</title>
<style>
  body { font: 11pt/1.5 Arial, sans-serif; color: #1f2937; margin: 0; }
  .frame { border: 2px dashed #ff5a1f; padding: 6mm; }
  h1 { font-size: 22pt; margin: 0 0 3mm; color: #0b1020; }
  h2 { font-size: 14pt; margin: 6mm 0 2mm; color: #0b1020; }
  .band { background: linear-gradient(90deg, #0b1020, #3b0764); color: #fff; padding: 4mm 6mm; border-radius: 3mm; }
  .note { background: #fff7ed; border-left: 4px solid #ff5a1f; padding: 3mm 4mm; }
  table { border-collapse: collapse; width: 100%; margin-top: 3mm; }
  th, td { border: 1px solid #d1d5db; padding: 1.5mm 2.5mm; text-align: left; }
  th { background: #e0e7ff; }
  .page-break { break-before: page; }
</style></head>
<body>
<div class="frame">
  <div class="band"><h1 style="color:#fff">Field report: the Rhône sensors</h1>Page one of five: the dashed line is the page area's edge.</div>
  <h2>1. Where the sensors are</h2>
  <p>Forty-two stations along the river send a reading every ten minutes. The report below follows them from the lake to the sea, one section a page, so that the options that choose pages, sizes and margins show what they do.</p>
  <p class="note">A coloured band and a tinted note: printed with <code>PrintBackground</code> on, left white without it.</p>
  <table><tr><th>Station</th><th>Kilometre</th><th>Level (m)</th></tr>
    <tr><td>Genève</td><td>0</td><td>372.1</td></tr><tr><td>Seyssel</td><td>48</td><td>254.6</td></tr><tr><td>Lyon</td><td>232</td><td>162.3</td></tr></table>
</div>
<div class="frame page-break"><div class="band">Page two of five</div><h2>2. The upper river</h2><p>The upper river is fast and cold: its stations read the level every ten minutes and the temperature every hour.</p></div>
<div class="frame page-break"><div class="band">Page three of five</div><h2>3. Lyon</h2><p>At Lyon the Saône joins: the station reads both rivers.</p></div>
<div class="frame page-break"><div class="band">Page four of five</div><h2>4. The lower river</h2><p>Dams turn the lower river into a staircase of reaches.</p></div>
<div class="frame page-break"><div class="band">Page five of five</div><h2>5. The delta</h2><p>In the Camargue the river splits in two before the sea.</p></div>
</body></html>
None
var result = HtmlToPdf.Render(html, new HtmlPdfOptions { Compression = HtmlPdfCompression.None });
<!DOCTYPE html>
<html lang="en"><head><meta charset="utf-8"><title>Field report: the Rhône sensors</title>
<style>
  body { font: 11pt/1.5 Arial, sans-serif; color: #1f2937; margin: 0; }
  .frame { border: 2px dashed #ff5a1f; padding: 6mm; }
  h1 { font-size: 22pt; margin: 0 0 3mm; color: #0b1020; }
  h2 { font-size: 14pt; margin: 6mm 0 2mm; color: #0b1020; }
  .band { background: linear-gradient(90deg, #0b1020, #3b0764); color: #fff; padding: 4mm 6mm; border-radius: 3mm; }
  .note { background: #fff7ed; border-left: 4px solid #ff5a1f; padding: 3mm 4mm; }
  table { border-collapse: collapse; width: 100%; margin-top: 3mm; }
  th, td { border: 1px solid #d1d5db; padding: 1.5mm 2.5mm; text-align: left; }
  th { background: #e0e7ff; }
  .page-break { break-before: page; }
</style></head>
<body>
<div class="frame">
  <div class="band"><h1 style="color:#fff">Field report: the Rhône sensors</h1>Page one of five: the dashed line is the page area's edge.</div>
  <h2>1. Where the sensors are</h2>
  <p>Forty-two stations along the river send a reading every ten minutes. The report below follows them from the lake to the sea, one section a page, so that the options that choose pages, sizes and margins show what they do.</p>
  <p class="note">A coloured band and a tinted note: printed with <code>PrintBackground</code> on, left white without it.</p>
  <table><tr><th>Station</th><th>Kilometre</th><th>Level (m)</th></tr>
    <tr><td>Genève</td><td>0</td><td>372.1</td></tr><tr><td>Seyssel</td><td>48</td><td>254.6</td></tr><tr><td>Lyon</td><td>232</td><td>162.3</td></tr></table>
</div>
<div class="frame page-break"><div class="band">Page two of five</div><h2>2. The upper river</h2><p>The upper river is fast and cold: its stations read the level every ten minutes and the temperature every hour.</p></div>
<div class="frame page-break"><div class="band">Page three of five</div><h2>3. Lyon</h2><p>At Lyon the Saône joins: the station reads both rivers.</p></div>
<div class="frame page-break"><div class="band">Page four of five</div><h2>4. The lower river</h2><p>Dams turn the lower river into a staircase of reaches.</p></div>
<div class="frame page-break"><div class="band">Page five of five</div><h2>5. The delta</h2><p>In the Camargue the river splits in two before the sea.</p></div>
</body></html>
A user password, no copying
var result = HtmlToPdf.Render(html, new HtmlPdfOptions
{
    Security = new HtmlPdfSecurity { UserPassword = "open-me", OwnerPassword = "owner-secret", PermitCopying = false },
});
<!DOCTYPE html>
<html lang="en"><head><meta charset="utf-8"><title>Field report: the Rhône sensors</title>
<style>
  body { font: 11pt/1.5 Arial, sans-serif; color: #1f2937; margin: 0; }
  .frame { border: 2px dashed #ff5a1f; padding: 6mm; }
  h1 { font-size: 22pt; margin: 0 0 3mm; color: #0b1020; }
  h2 { font-size: 14pt; margin: 6mm 0 2mm; color: #0b1020; }
  .band { background: linear-gradient(90deg, #0b1020, #3b0764); color: #fff; padding: 4mm 6mm; border-radius: 3mm; }
  .note { background: #fff7ed; border-left: 4px solid #ff5a1f; padding: 3mm 4mm; }
  table { border-collapse: collapse; width: 100%; margin-top: 3mm; }
  th, td { border: 1px solid #d1d5db; padding: 1.5mm 2.5mm; text-align: left; }
  th { background: #e0e7ff; }
  .page-break { break-before: page; }
</style></head>
<body>
<div class="frame">
  <div class="band"><h1 style="color:#fff">Field report: the Rhône sensors</h1>Page one of five: the dashed line is the page area's edge.</div>
  <h2>1. Where the sensors are</h2>
  <p>Forty-two stations along the river send a reading every ten minutes. The report below follows them from the lake to the sea, one section a page, so that the options that choose pages, sizes and margins show what they do.</p>
  <p class="note">A coloured band and a tinted note: printed with <code>PrintBackground</code> on, left white without it.</p>
  <table><tr><th>Station</th><th>Kilometre</th><th>Level (m)</th></tr>
    <tr><td>Genève</td><td>0</td><td>372.1</td></tr><tr><td>Seyssel</td><td>48</td><td>254.6</td></tr><tr><td>Lyon</td><td>232</td><td>162.3</td></tr></table>
</div>
<div class="frame page-break"><div class="band">Page two of five</div><h2>2. The upper river</h2><p>The upper river is fast and cold: its stations read the level every ten minutes and the temperature every hour.</p></div>
<div class="frame page-break"><div class="band">Page three of five</div><h2>3. Lyon</h2><p>At Lyon the Saône joins: the station reads both rivers.</p></div>
<div class="frame page-break"><div class="band">Page four of five</div><h2>4. The lower river</h2><p>Dams turn the lower river into a staircase of reaches.</p></div>
<div class="frame page-break"><div class="band">Page five of five</div><h2>5. The delta</h2><p>In the Camargue the river splits in two before the sea.</p></div>
</body></html>
Title, author, PDF/A
var result = HtmlToPdf.Render(html, new HtmlPdfOptions { Title = "Rhône field report", Author = "Hydrology team", PdfA = true });
A page held to its limits: here two pages at most. The render stops there, prints what it has, and says so: Completed is false and a note tells which limit.
<!DOCTYPE html>
<html lang="en"><head><meta charset="utf-8"><title>Field report: the Rhône sensors</title>
<style>
  body { font: 11pt/1.5 Arial, sans-serif; color: #1f2937; margin: 0; }
  .frame { border: 2px dashed #ff5a1f; padding: 6mm; }
  h1 { font-size: 22pt; margin: 0 0 3mm; color: #0b1020; }
  h2 { font-size: 14pt; margin: 6mm 0 2mm; color: #0b1020; }
  .band { background: linear-gradient(90deg, #0b1020, #3b0764); color: #fff; padding: 4mm 6mm; border-radius: 3mm; }
  .note { background: #fff7ed; border-left: 4px solid #ff5a1f; padding: 3mm 4mm; }
  table { border-collapse: collapse; width: 100%; margin-top: 3mm; }
  th, td { border: 1px solid #d1d5db; padding: 1.5mm 2.5mm; text-align: left; }
  th { background: #e0e7ff; }
  .page-break { break-before: page; }
</style></head>
<body>
<div class="frame">
  <div class="band"><h1 style="color:#fff">Field report: the Rhône sensors</h1>Page one of five: the dashed line is the page area's edge.</div>
  <h2>1. Where the sensors are</h2>
  <p>Forty-two stations along the river send a reading every ten minutes. The report below follows them from the lake to the sea, one section a page, so that the options that choose pages, sizes and margins show what they do.</p>
  <p class="note">A coloured band and a tinted note: printed with <code>PrintBackground</code> on, left white without it.</p>
  <table><tr><th>Station</th><th>Kilometre</th><th>Level (m)</th></tr>
    <tr><td>Genève</td><td>0</td><td>372.1</td></tr><tr><td>Seyssel</td><td>48</td><td>254.6</td></tr><tr><td>Lyon</td><td>232</td><td>162.3</td></tr></table>
</div>
<div class="frame page-break"><div class="band">Page two of five</div><h2>2. The upper river</h2><p>The upper river is fast and cold: its stations read the level every ten minutes and the temperature every hour.</p></div>
<div class="frame page-break"><div class="band">Page three of five</div><h2>3. Lyon</h2><p>At Lyon the Saône joins: the station reads both rivers.</p></div>
<div class="frame page-break"><div class="band">Page four of five</div><h2>4. The lower river</h2><p>Dams turn the lower river into a staircase of reaches.</p></div>
<div class="frame page-break"><div class="band">Page five of five</div><h2>5. The delta</h2><p>In the Camargue the river splits in two before the sea.</p></div>
</body></html>
MaxPages = 2
var result = HtmlToPdf.Render(html, new HtmlPdfOptions { Limits = HtmlPdfLimits.Default with { MaxPages = 2 } });
Console.WriteLine($"{result.PageCount} pages, completed: {result.Completed}");
<!DOCTYPE html>
<html lang="en"><head><meta charset="utf-8"><title>Notes</title>
<style>body { font: 12pt/1.5 Arial, sans-serif; margin: 0; } .odd { font-family: "Some Font Nobody Has", serif; }</style></head>
<body>
<h1>A page with problems</h1>
<p><img src="missing-picture.png" alt="A picture that is not there" width="120" height="60"></p>
<p class="odd">Text in a font family the machine does not have.</p>
<p><img src="https://cdn.example.com/banner.png" alt="A picture on another host" width="120" height="60"></p>
<script>
  document.body.append('The script ran up to here; ');
  undefinedFunction();
</script>
</body></html>
A page with problems
var result = HtmlToPdf.Render(html);
foreach (var note in result.Notes)
    Console.WriteLine($"{note.Severity} {note.Code}: {note.Message}");
Warning scriptError: ReferenceError: undefinedFunction is not defined | at about:blank#script-25:11:3 | at HostDelegate.<anonymous> (<anonymous>) | at Object.hostCall (ssrs2-dom.js:35362:11)
Warning resourceFailed: Image "missing-picture.png" is not a URL that resolves against no base URL.
Info resourceRefused: Image https://cdn.example.com/banner.png: no resource loader was given (only data: URLs load).
Info scriptsRan: The page's scripts ran (17 ms of virtual time, 4 tasks; 0 canvases drawn).
Info notImplemented: A picture that did not load shows its alternative text; Chrome's broken-image icon beside it is laid out but not drawn.
Info fontFamilyMissing: The font family "Some Font Nobody Has" is not on this machine: its text goes to the next family.
The browser the page sees
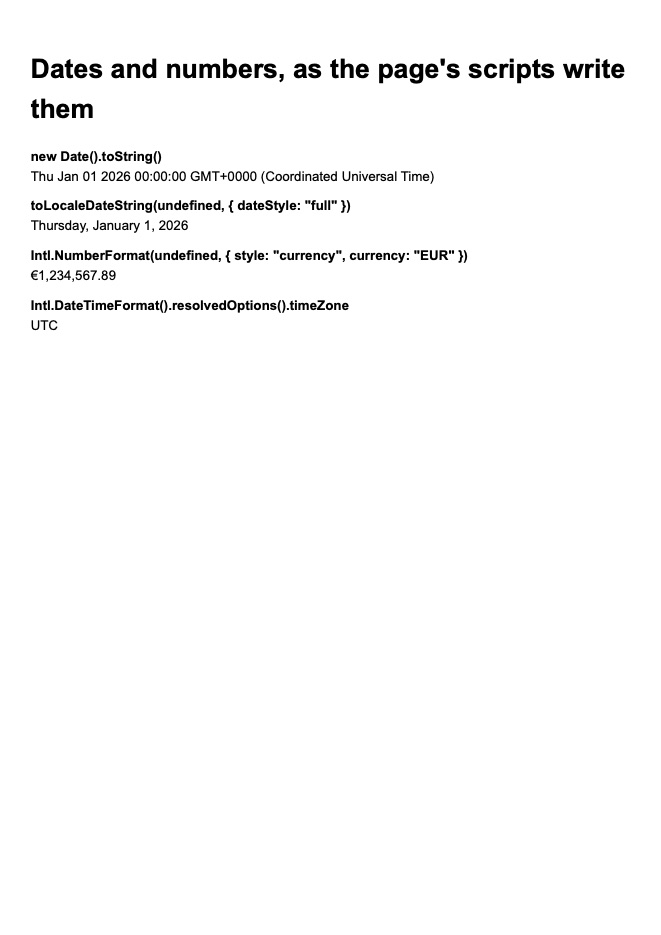
By default a page sees desktop Chrome 156 on the machine's own OS. These pages were made on macOS.
Info scriptsRan: The page's scripts ran (17 ms of virtual time, 2 tasks; 0 canvases drawn).
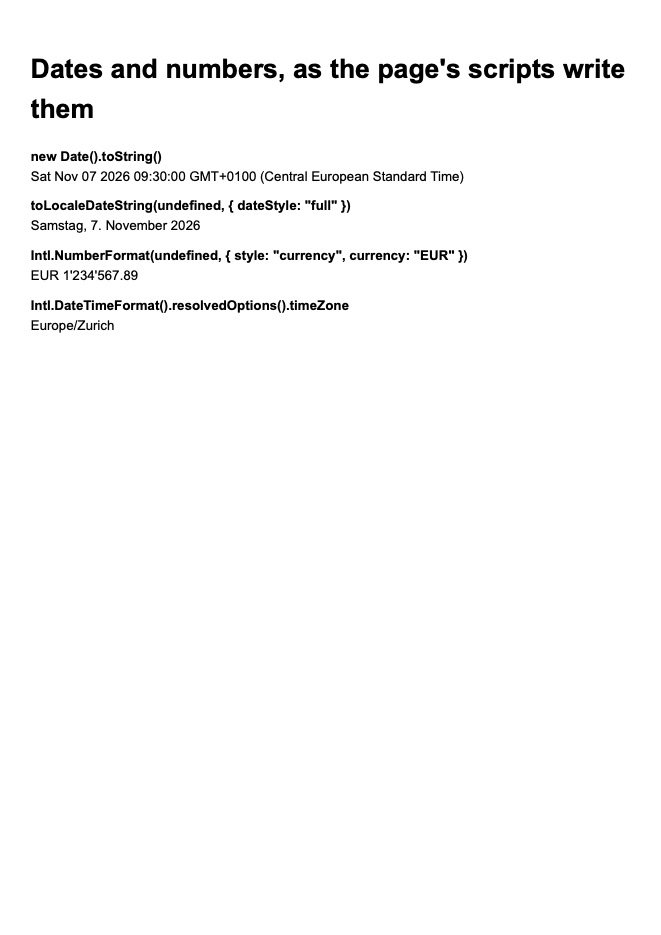
de-CH, Europe/Zurich, a fixed clock
var result = HtmlToPdf.Render(html, new HtmlPdfOptions
{
    Locale = "de-CH",
    TimeZone = "Europe/Zurich",
    Now = new DateTimeOffset(2026, 11, 7, 9, 30, 0, TimeSpan.FromHours(1)),
});
<!DOCTYPE html>
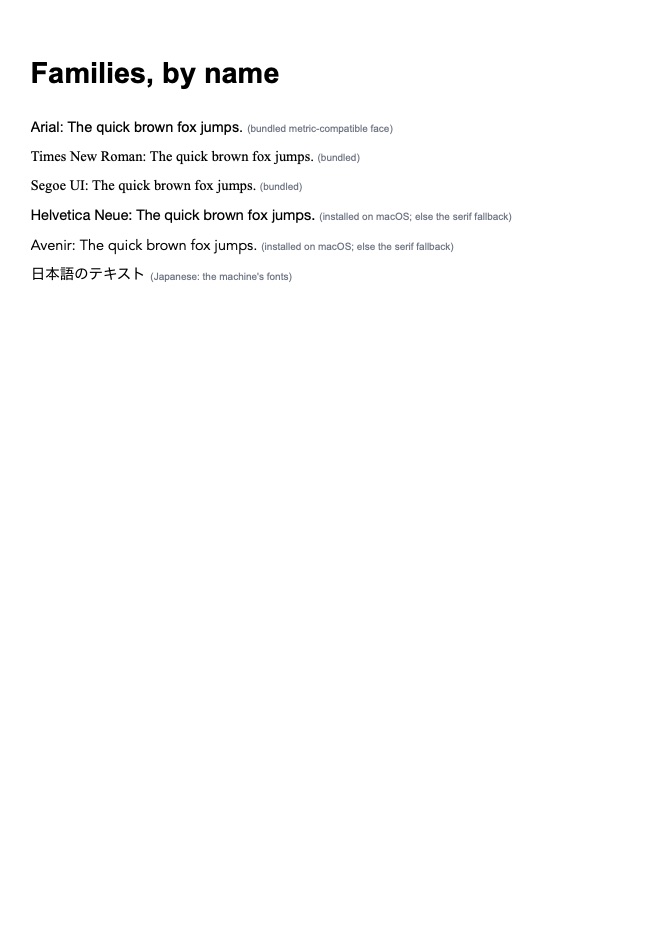
<html lang="en"><head><meta charset="utf-8"><title>Fonts</title>
<style>body { font: 13pt/1.6 Arial, sans-serif; margin: 0; } p { margin: 2mm 0; } span { color: #6b7280; font: 9pt Arial; }</style></head>
<body>
<h1>Families, by name</h1>
<p style="font-family: Arial">Arial: The quick brown fox jumps. <span>(bundled metric-compatible face)</span></p>
<p style="font-family: 'Times New Roman'">Times New Roman: The quick brown fox jumps. <span>(bundled)</span></p>
<p style="font-family: 'Segoe UI'">Segoe UI: The quick brown fox jumps. <span>(bundled)</span></p>
<p style="font-family: 'Helvetica Neue', serif">Helvetica Neue: The quick brown fox jumps. <span>(installed on macOS; else the serif fallback)</span></p>
<p style="font-family: Avenir, serif">Avenir: The quick brown fox jumps. <span>(installed on macOS; else the serif fallback)</span></p>
<p style="font-family: 'Hiragino Sans', serif">日本語のテキスト <span>(Japanese: the machine's fonts)</span></p>
</body></html>
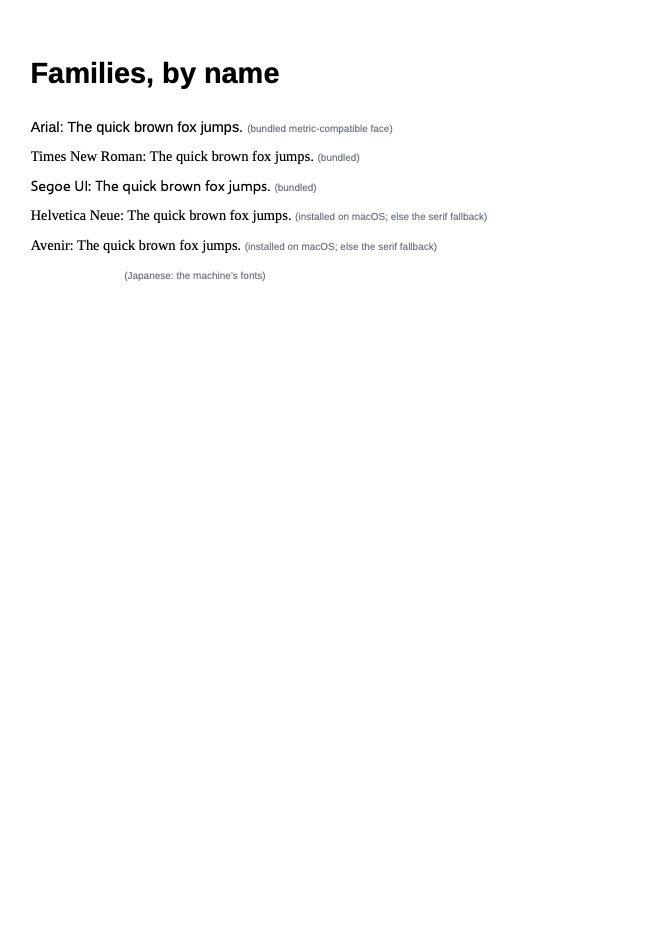
Info fontFamilyMissing: The font family "Helvetica Neue" is not in the font profile "reference": its text goes to the next family.
Info fontFamilyMissing: The font family "Avenir" is not in the font profile "reference": its text goes to the next family.
Info fontFamilyMissing: The font family "Hiragino Sans" is not in the font profile "reference": its text goes to the next family.
Warning missingGlyph: No font of 'Hiragino Sans, serif' nor the fallback has a glyph for a character: drawn as .notdef.
Lists that load as you scroll
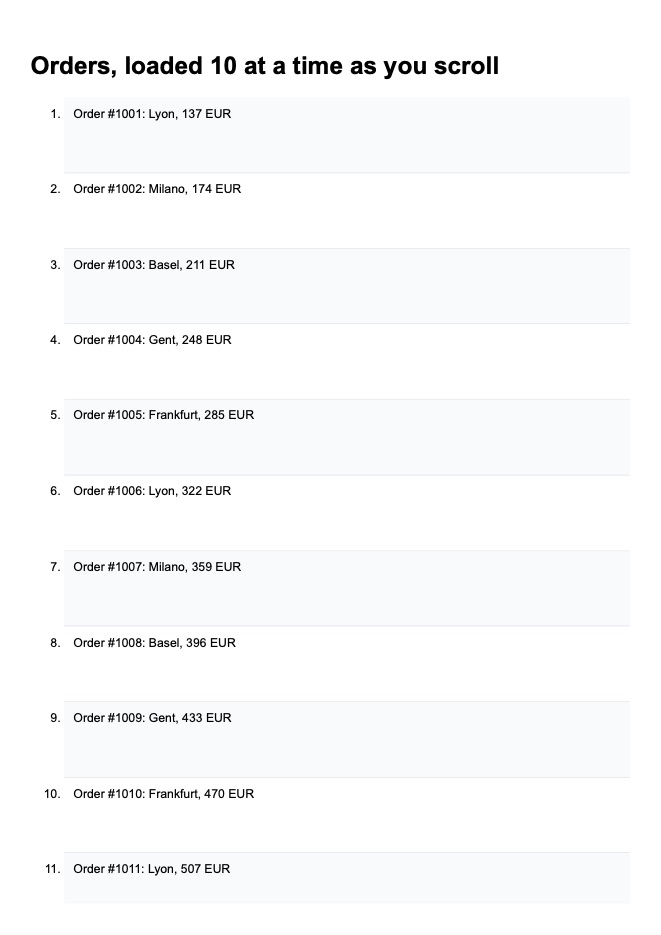
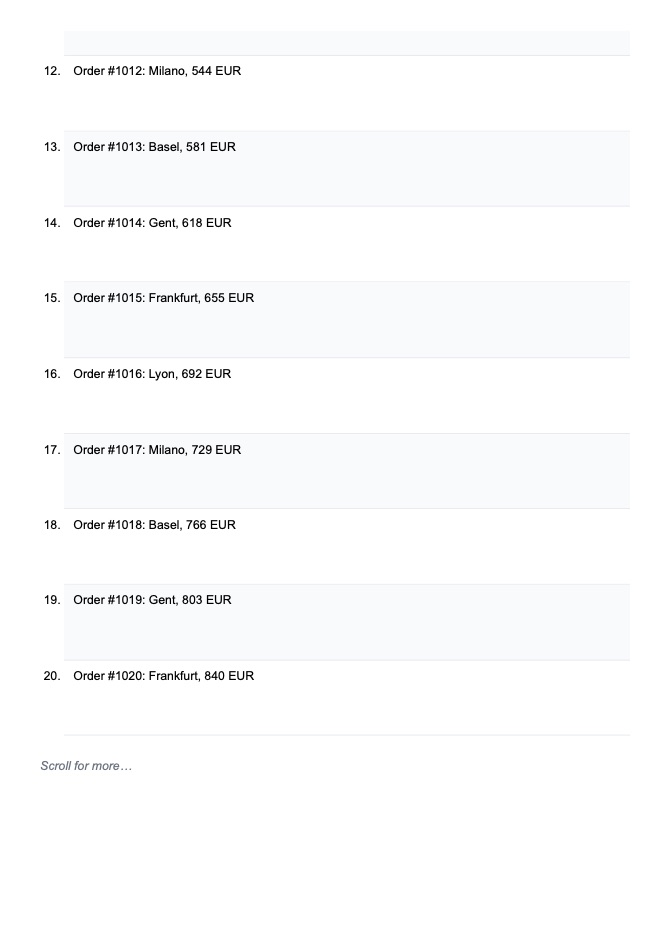
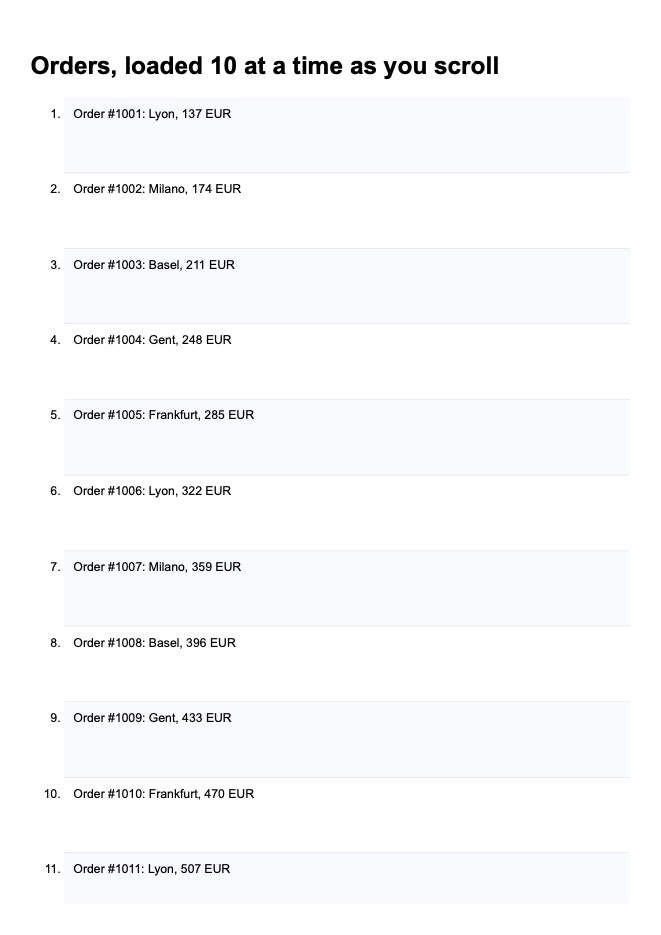
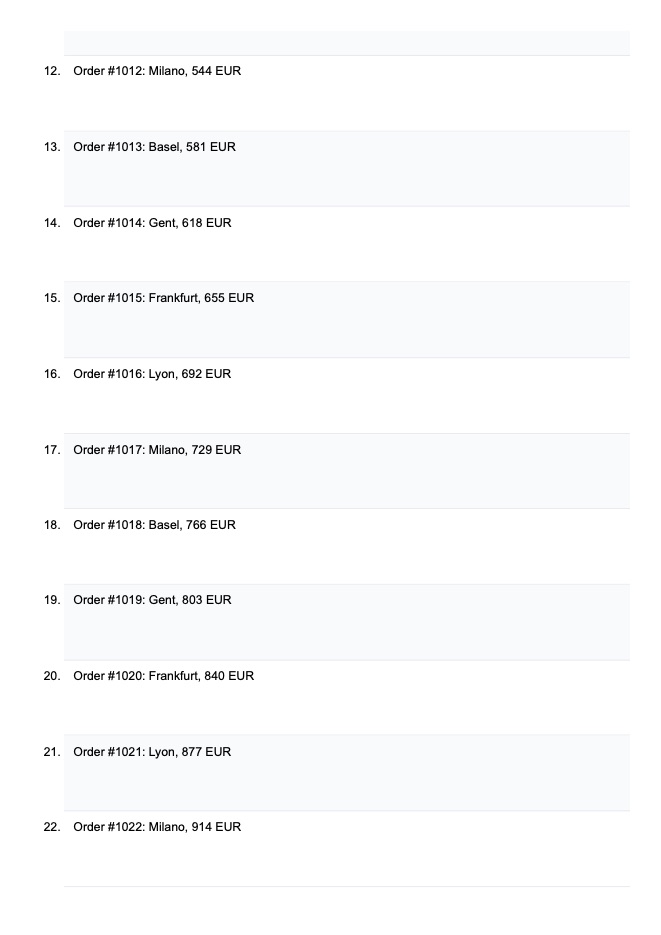
An infinite list loads its next ten orders each time its bottom comes into view. Without a scroll option, Weblitz's IntersectionObserver reports the bottom visible once, so the PDF holds twenty; ScrollThrough scrolls the window down a window height at a time, each step waiting ScrollStepWait of virtual time, so the list loads to its end and all sixty are printed.
<!DOCTYPE html>
<html lang="en"><head><meta charset="utf-8"><title>A list that loads as you scroll</title>
<style>
  body { font: 11pt/1.4 Arial, sans-serif; margin: 0; }
  li { padding: 2.2mm 3mm; min-height: 24mm; box-sizing: border-box; border-bottom: 1px solid #e5e7eb; }
  li:nth-child(odd) { background: #f8fafc; }
  #more { padding: 3mm; color: #6b7280; font-style: italic; }
</style></head>
<body>
<h1>Orders, loaded 10 at a time as you scroll</h1>
<ol id="list"></ol>
<p id="more">Scroll for more…</p>
<script>
  // An infinite list as sites write it: the next ten orders load when the bottom comes into view, up to 60
  let loaded = 0;
  const list = document.getElementById('list');
  function loadMore() {
    for (let i = 0; i < 10 && loaded < 60; i++) {
      loaded++;
      const li = document.createElement('li');
      li.textContent = `Order #${1000 + loaded}: ${['Frankfurt', 'Lyon', 'Milano', 'Basel', 'Gent'][loaded % 5]}, ${(loaded * 37) % 900 + 100} EUR`;
      list.append(li);
    }
    if (loaded >= 60) document.getElementById('more').textContent = 'All 60 orders loaded.';
  }
  loadMore();
  new IntersectionObserver((entries) => { if (entries.some(e => e.isIntersecting)) setTimeout(loadMore, 100); })
    .observe(document.getElementById('more'));
</script>
</body></html>
Info scriptsRan: The page's scripts ran (884 ms of virtual time, 40 tasks; 0 canvases drawn).
Scrolling to a section first
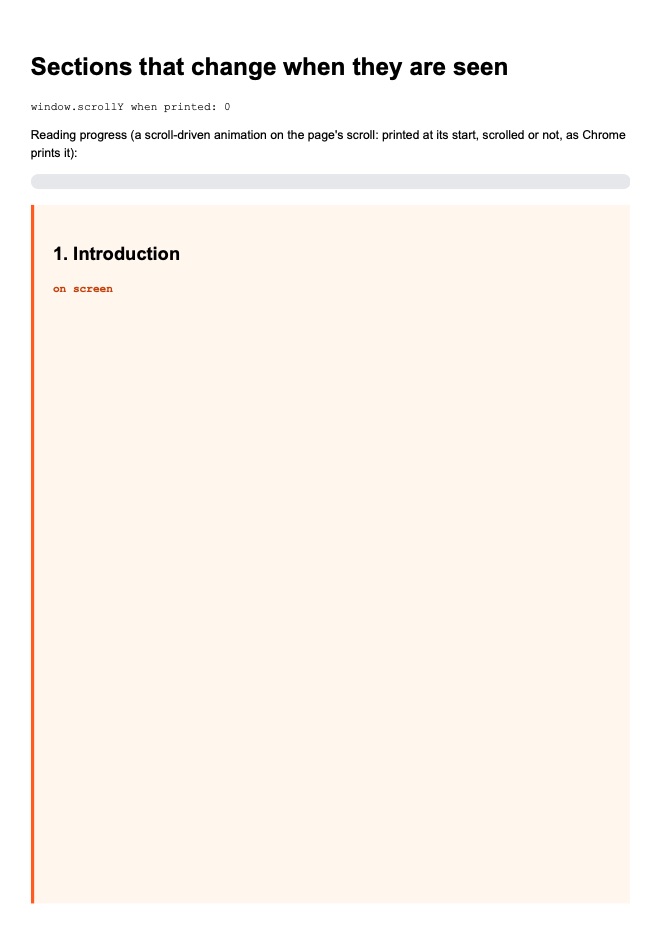
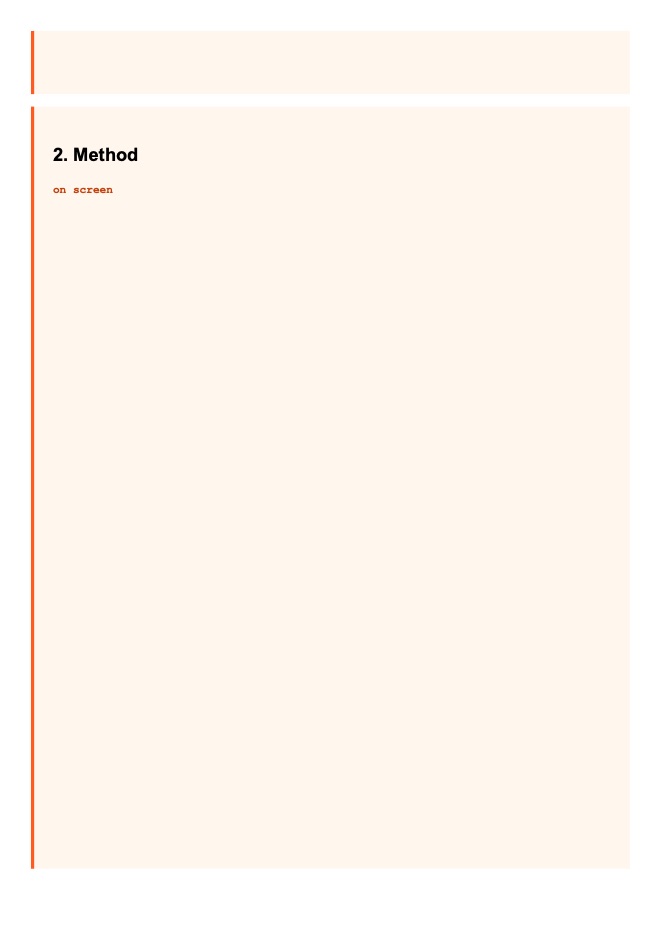
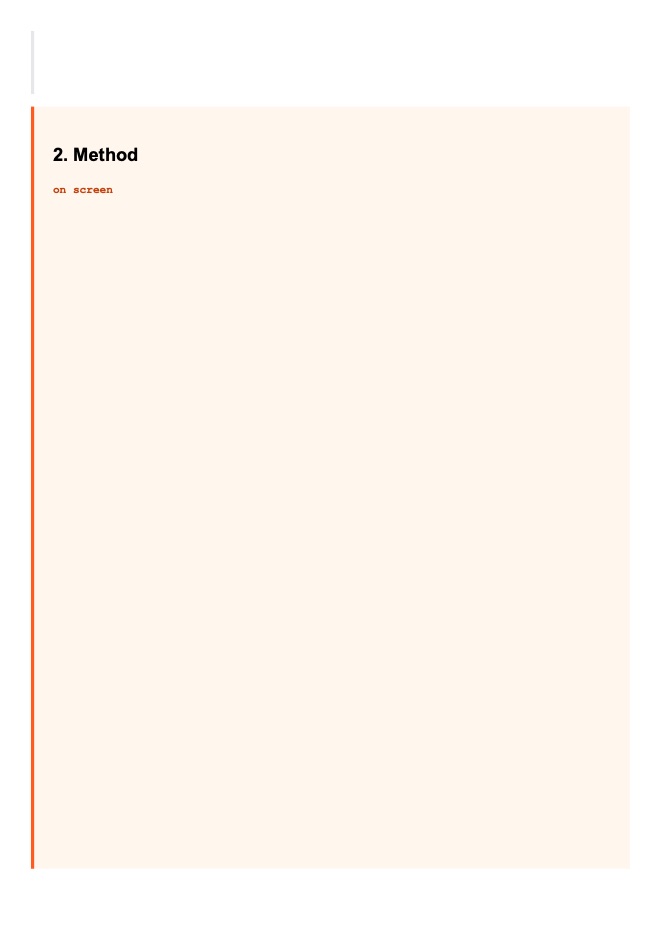
ScrollTo scrolls the window before printing, as a user would before pressing Print: the page's scroll events and IntersectionObserver callbacks see it (here the sections that went off screen, and scrollY). A scroll timeline on the page's own scroll prints at its start either way, as Chrome prints it. The PDF still holds the whole document from its top.
Info scriptsRan: The page's scripts ran (50 ms of virtual time, 6 tasks; 0 canvases drawn).
Printing a part of the page
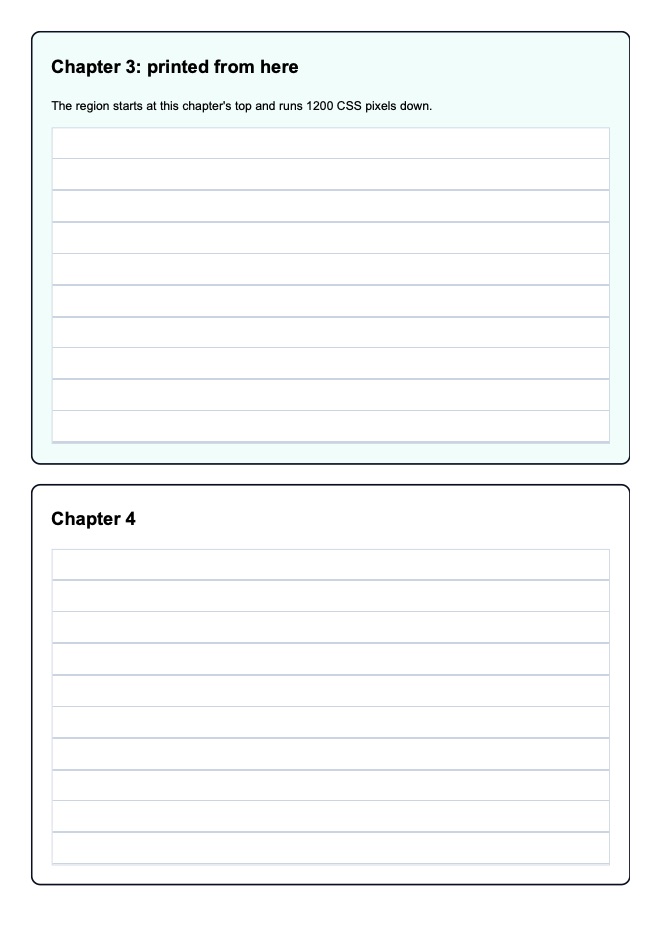
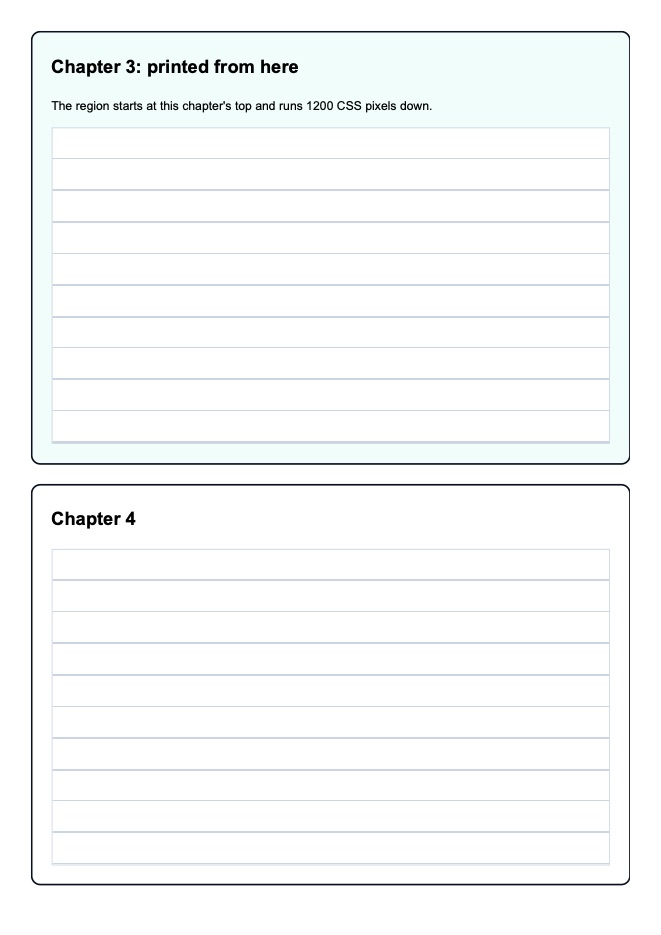
Region prints a part of the document, from a start (the scroll position, a length, an element) for a height; what lies above and below is left out, and the part is laid out on pages as a whole document is.
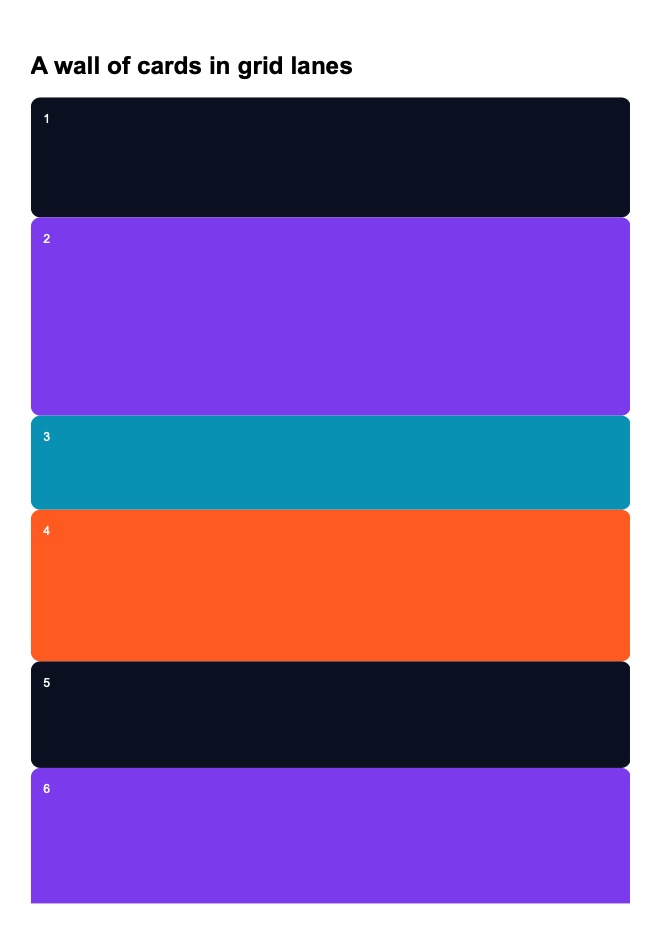
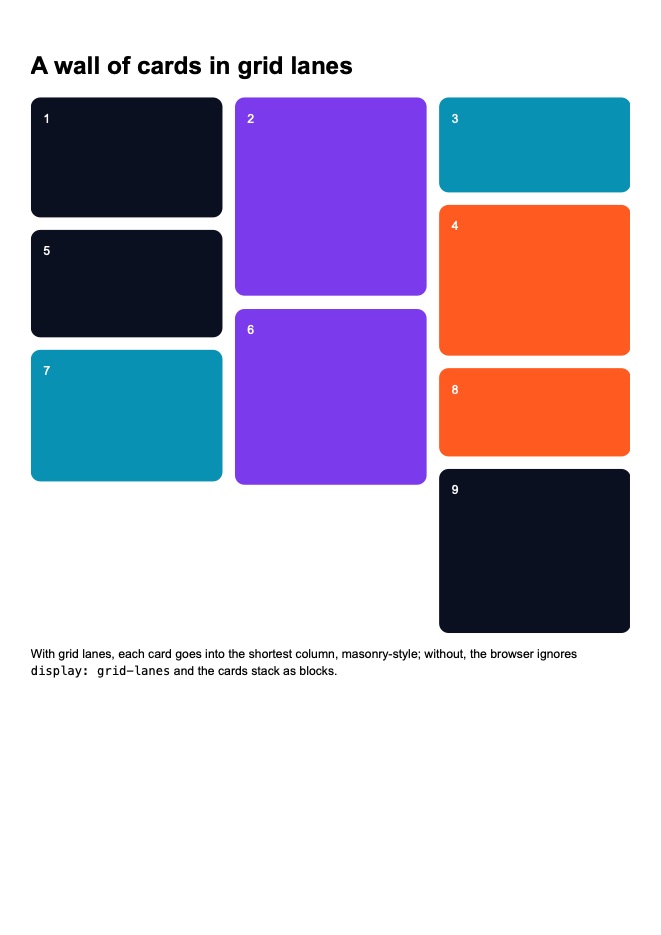
Off by default, as stable Chrome prints; on, the features Chrome 156 has behind its "Experimental Web Platform features" flag that Weblitz has built, grid lanes among them.